Rover · 2024–2025 · Search & Supply
Service Areas
& Travel Distance
+4% bookings · +7% match quality
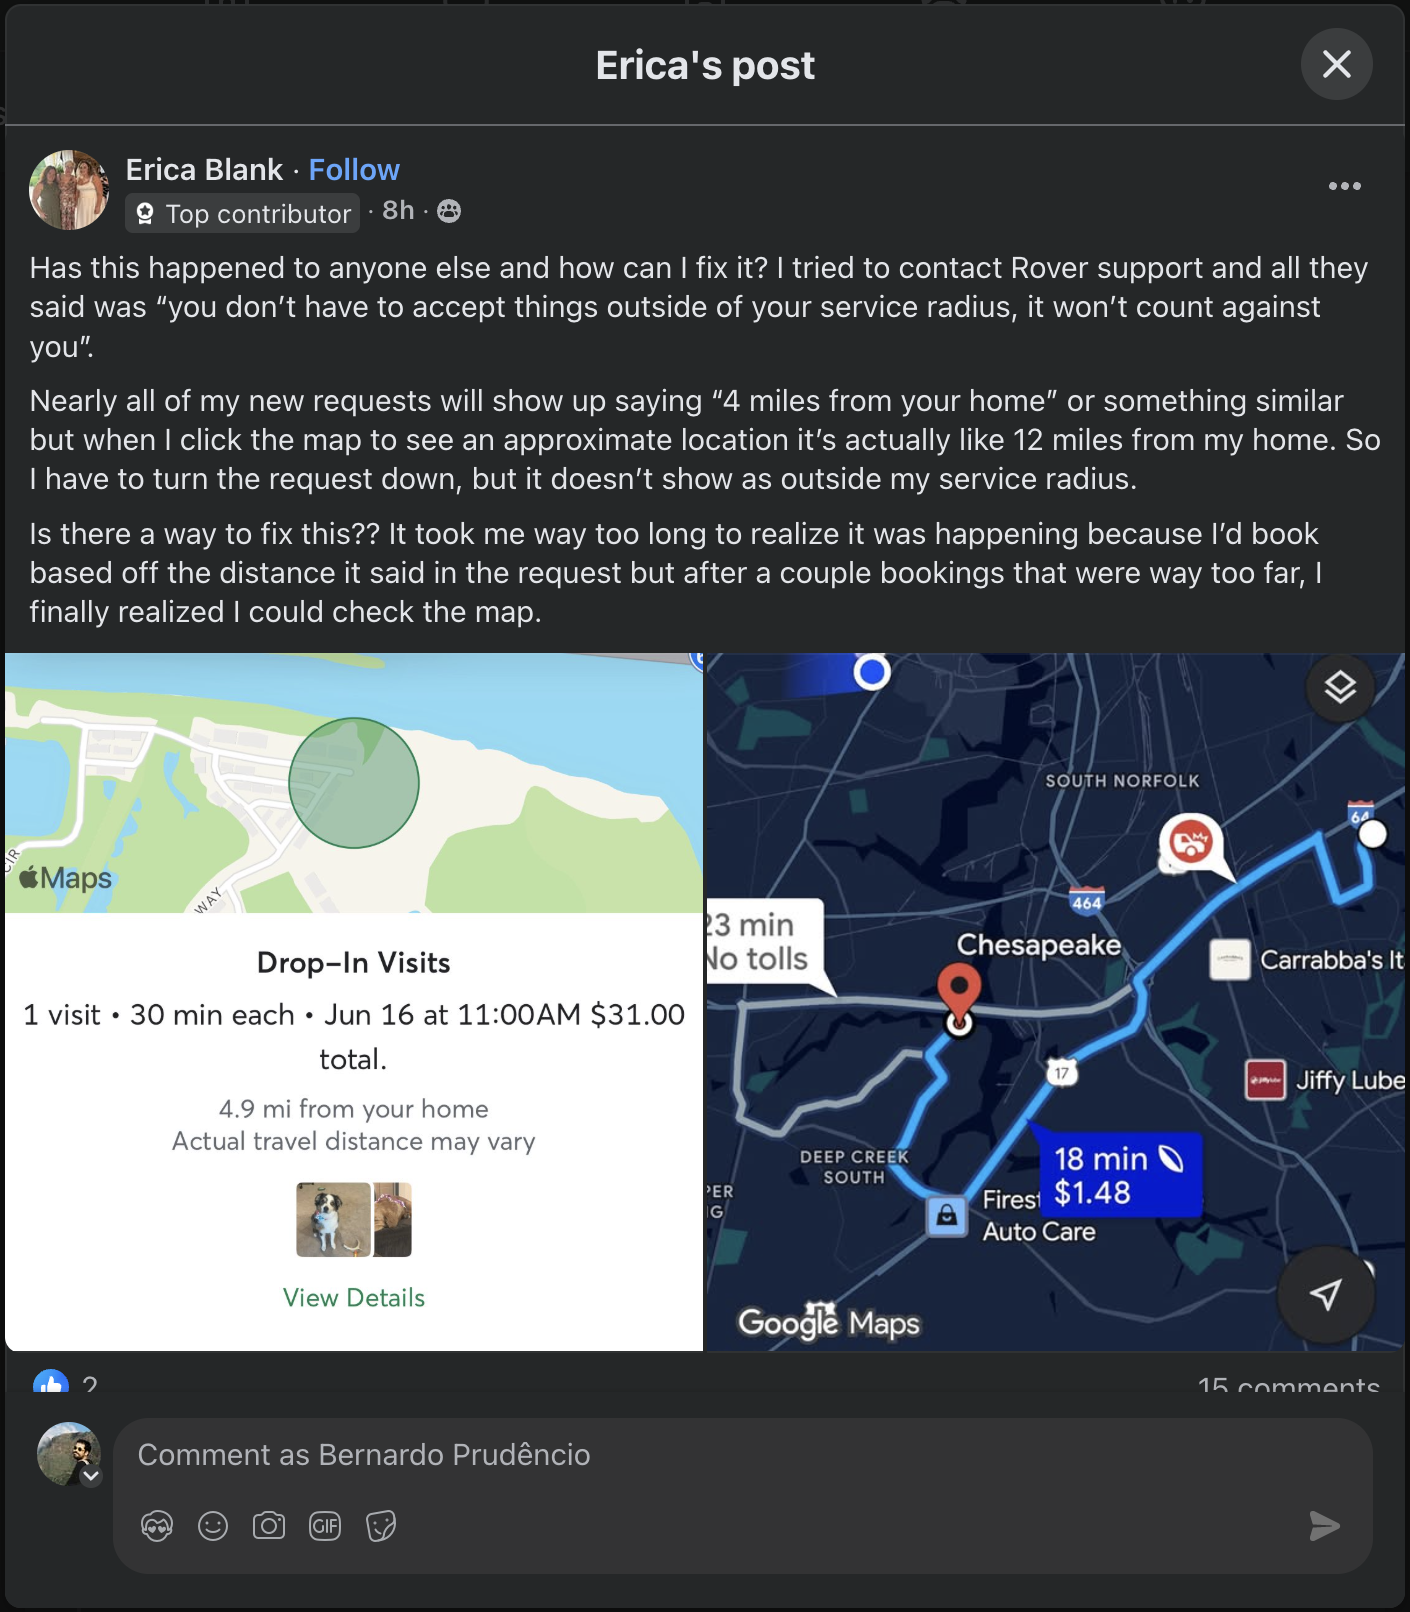
Sitters historically set a circular radius — blind to real geography. The feedback was consistent: "I'm getting requests within my radius that are practically impossible." This started at a Maker Days hackathon and became a global feature.
As lead product designer, I was responsible for the full travel-distance service area experience — from exploratory research through experiment design, global rollout, and search integration.
In moderated sessions, sitters reacted to their areas being redrawn, adjusted distance/time and travel mode, and talked through how far they'd go for different services.
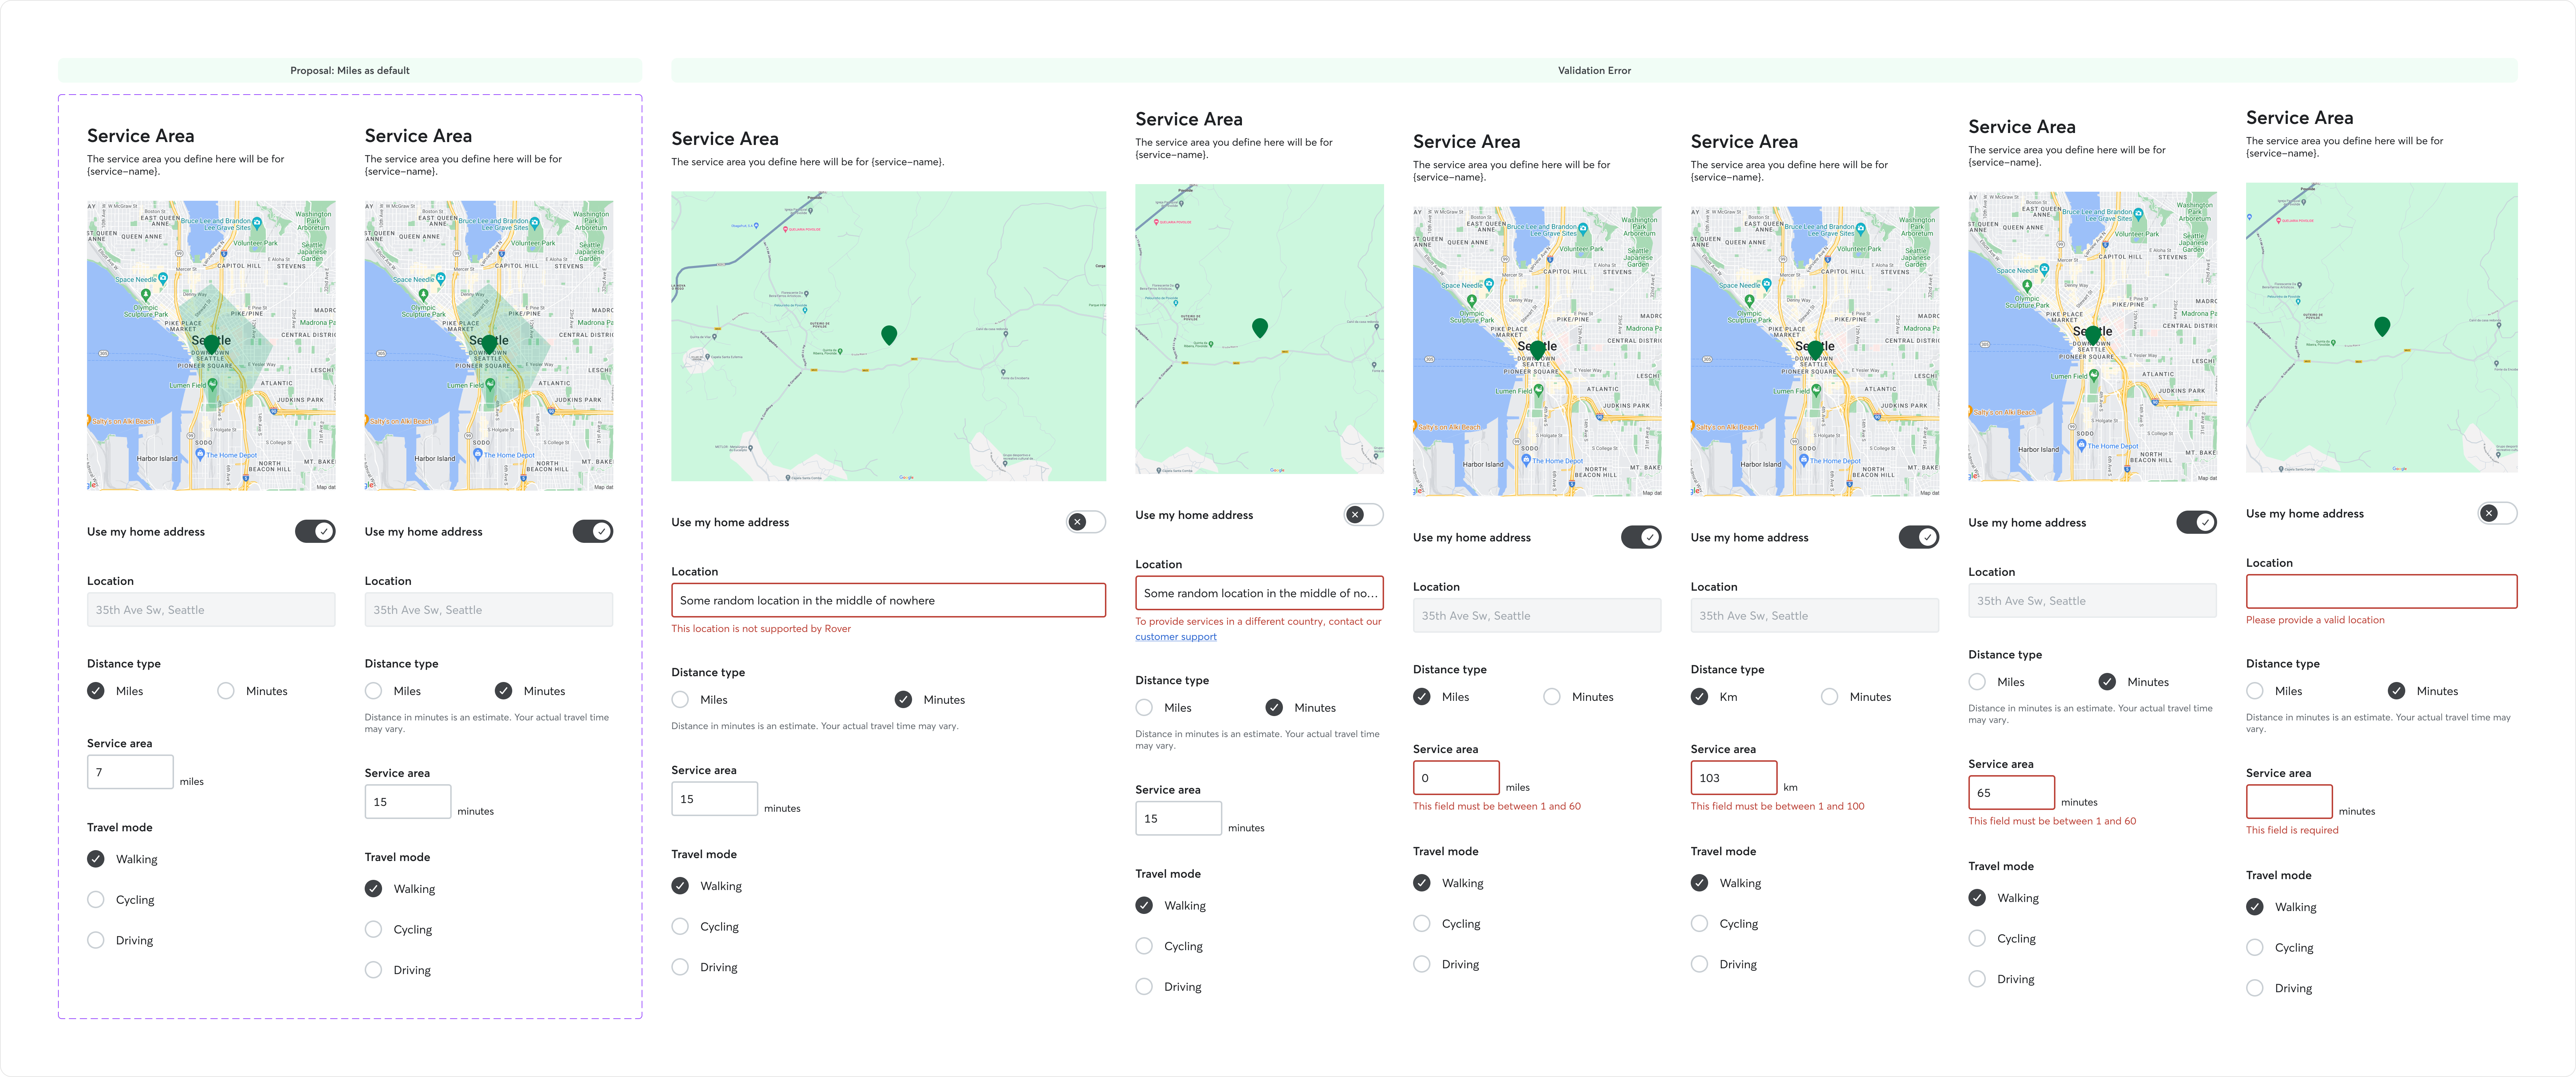
Three design anchors: sitters think in miles and minutes; irregular road-based shapes feel more intuitive than circles; different services need different areas.
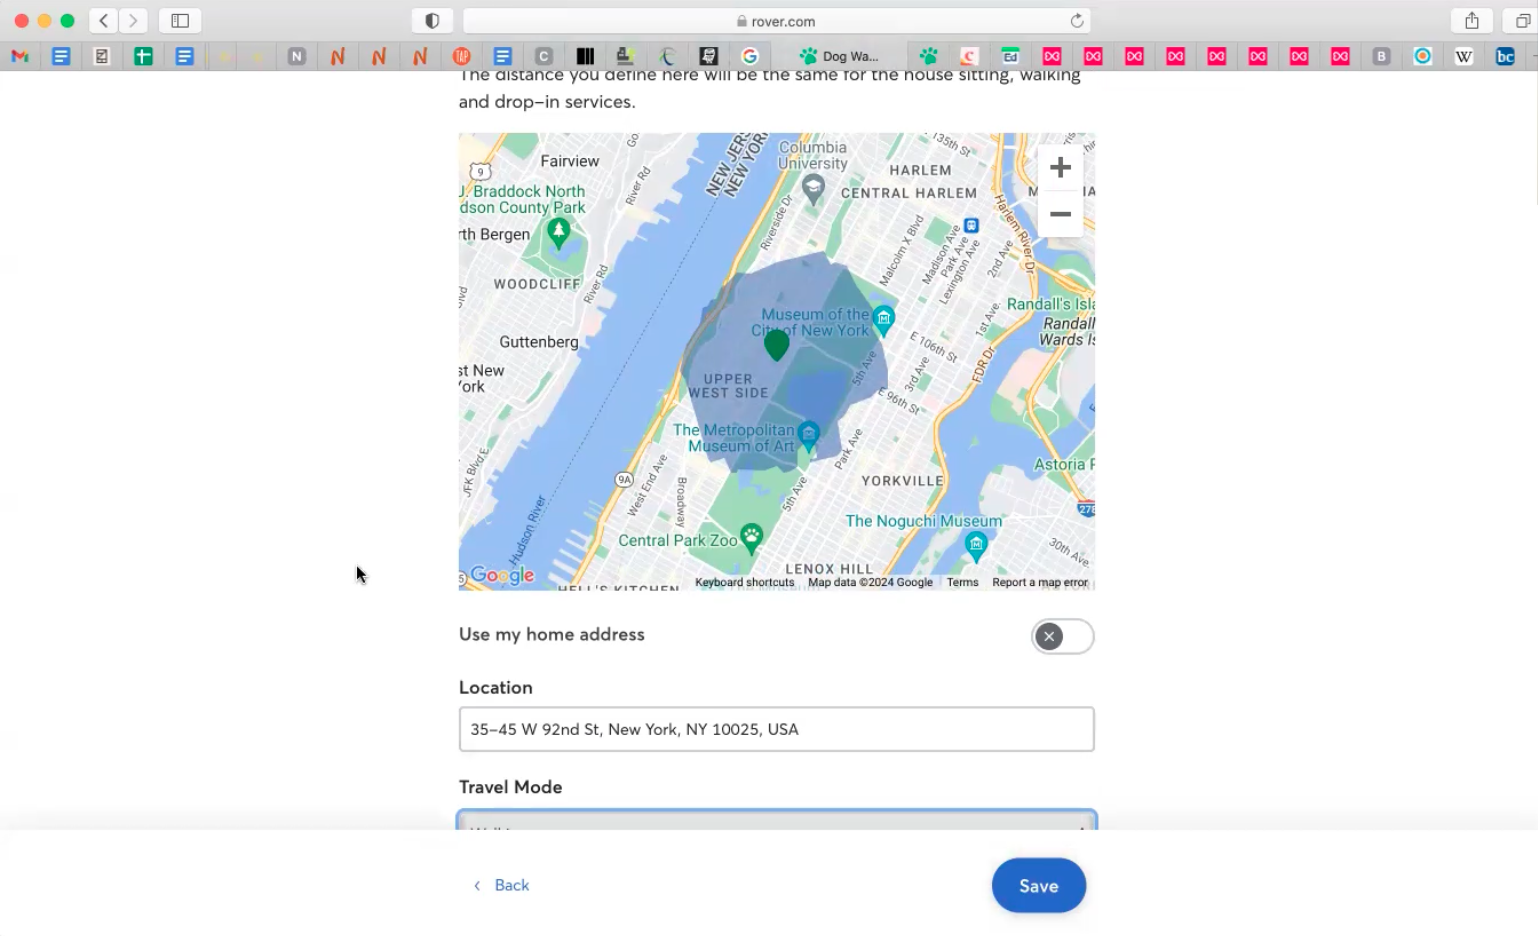
Sitters can now define service areas by distance (1–100 km/mi) or estimated travel time (1–60 min), with walking, cycling, or driving modes. House sitting, drop-ins, and walks each get their own area — matching how sitters think about effort vs. reward.
Mapbox isochrones generate realistic polygons that respect roads, water, and barriers. Existing radii were backfilled automatically so sitters could refine rather than restart.
Two geographic A/B tests. Both waves showed better matching, better conversion, and strong sitter adoption. We committed to global rollout instead of extending the split.
Search-to-request +2–3%. Search-to-book +1.6–2.8%. Match quality +7%. Revenue per searcher +5–6% in US markets.